
Home  /  Services  /  Software Development · Business & Analytics Dashboards

Business & Analytics Dashboards

One screen that tells the truth about the business — live, not last month’s spreadsheet.

Data is not the problem; the distance between the data and the decision is. We build dashboards that sit between them: your numbers from the systems that actually hold them, refreshed on the schedule your business runs on, in a view the whole team can read in ten seconds.

  • Built on your real systems — POS, CRM, accounting, ads, spreadsheets
  • KPIs defined with you first, so the screen answers real decisions
  • Live or scheduled refresh — the data arrives when you need it
  • From a single operator screen to a boardroom roll-up
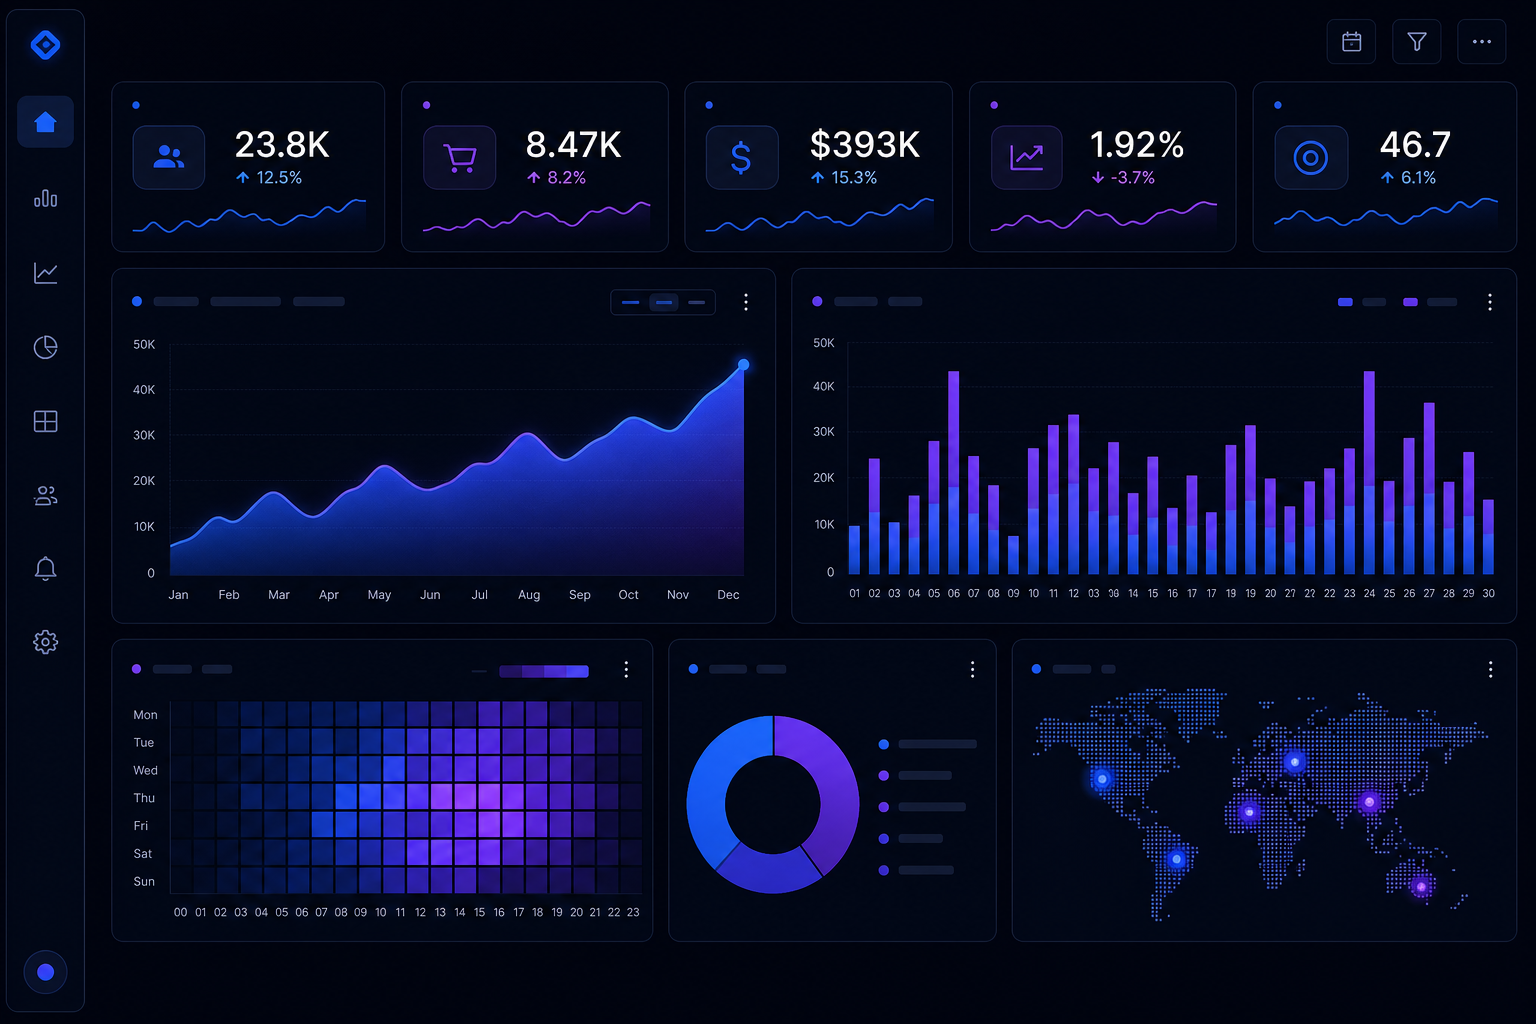
Visual representing Business & Analytics Dashboards
Software Development Outcomes first
THE SERVICE SYSTEMBusiness & Analytics Dashboards 14
Decide Source Unify

The problem

The morning spreadsheet ritual.

If your business runs on a spreadsheet that someone rebuilds every morning or every Monday, you already know the cost: the number is late, the number is “rough,” and half the team has a different copy. Decisions get made on a photo of the business, not the business.

The data exists — it is in the POS, the CRM, the bank feed, the ad platform, the warehouse count. What is missing is the machine that pulls it together, reconciles it and puts it in front of the person who has to decide, while it is still useful.

Sound familiar?

  • The “real” numbers take a day to assemble — and explain themselves poorly
  • Every department has its own version of the truth
  • You find out about the problem a week after it happened
  • The spreadsheet has a named owner, and that person is burned out

What we actually do

The dashboard stack.

Four layers, each doing one job well:

01

KPI design

The right number, honestly defined.

  • Decision-led KPI mapping: every metric tied to a decision and an owner
  • Definitions written down: what counts as a sale, a customer, a return
  • Targets and thresholds so green/red means something
  • Cohorts and comparisons — today vs. yesterday vs. the year before
02

Data engineering

The unglamorous part that makes it true.

  • Connectors to POS, CRM, accounting, ad platforms and spreadsheets
  • Reconciliation rules: when sources disagree, the board shows why
  • Scheduled and live pipelines with run monitoring
  • Historical backfill so trend lines start where the data starts
03

Visualization

Ten seconds to the point.

  • Operator, manager and board views of the same truth
  • Drill-downs that answer “why?” without leaving the screen
  • Mobile-friendly — the dashboard follows the phone
  • Readable in a warehouse or a boardroom, in under a minute
04

Alerting & action

The screen that talks back.

  • Threshold alerts to the right person, at the right channel
  • Anomaly detection on the metrics that can hurt you
  • Links from insight to action — open the order, fix the listing, call the supplier
  • Reporting that emails itself on the schedule your meetings run on

The machine

From scattered data to a single live view.

The pipeline we build between your systems and your decisions.

01

Decide

The first question is not “what charts?” It is “what decisions will this screen drive?” — and the KPIs are defined from those.

02

Source

We map where every number lives: POS, CRM, accounting, ads, inventory, the spreadsheet that is secretly the system of record.

03

Unify

A data layer pulls and reconciles the sources — one definition of revenue, one definition of a customer, one clock.

04

Visualize

Screens designed for the decision-maker: the operator view, the manager view, the board roll-up — each ten seconds to read.

05

Refresh

Live where it matters (today’s sales), scheduled where it is enough (monthly margin) — the refresh cost matches the decision speed.

06

Alert

The dashboard does not wait to be looked at: thresholds push alerts — stockout, margin dip, spend runaway — to the person who can act.

A dashboard nobody acts on is expensive wallpaper. We design for the action: every screen has a “so what?” and usually a link to fix it.

How it works

From “wish I could see that” to live.

Week 1

Decisions & KPIs

We interview the people who decide and write down the KPIs, definitions and alerts — the contract for the screen.

Week 2

Source mapping

Every data source located, sampled and profiled. The reconciliation rules are drafted where sources disagree.

Week 3–4

Build the spine

The data layer: connectors, definitions, history. You see real numbers arriving before the visuals exist.

Week 4–5

Screens

Operator, manager and board views designed and built on your data — reviewed, adjusted, approved.

Week 5–6

Alerts & handover

Thresholds, channels and the self-sending reports. Your team is trained on the numbers and what they mean.

Ongoing

Tend

Sources change, KPIs evolve. We keep the pipelines healthy and the definitions honest.

Scope of engagement

Every deliverable, named upfront.

  • KPI definitions and targets, written down and agreed
  • Data pipeline connecting your real systems
  • Operator, manager and board views of one truth
  • Drill-downs that answer “why?” in two clicks
  • Threshold alerts routed to the right people
  • Self-sending scheduled reports
  • Documentation: what each number means and where it comes from

FAQ

Dashboards, straight answers.

Sometimes that is the right answer, and we will say so. Off-the-shelf BI shines when your data is already clean and the decisions are standard. We build custom when the value is in the reconciliation — when the sources disagree, the definitions are messy, or the screen has to trigger actions, not just show charts. Often it is a hybrid: our data spine feeding a BI tool your team already likes.

“Live” is a spectrum we design deliberately. Today’s sales can refresh every few seconds from the POS; monthly margin is fine on an overnight run. We match the refresh rate to the decision speed — and to the cost. Paying for real-time on a number that only changes monthly is how dashboards get expensive for no reason.

Most that keep business data: POS, CRM, e-commerce platforms, accounting packages, ad platforms, payment gateways, warehouse systems, and — yes — the spreadsheets. If a system has an API, a file export or a database, we can usually pull from it. The source map at the start of the project is where we confirm each one.

Role-based from the design stage: the operator sees their floor, the manager sees the business, the board sees the roll-up. Same truth, different zoom — and nobody gets more visibility than their role needs.

What number do you wish you could see right now?

Tell us the decision you make every week and the number that should drive it. We will show you a dashboard sketch that answers it — before you commit to anything.

Still comparing options? Ask Alia, our growth assistant — bottom-right corner. She’ll point you to the right service or blueprint, and hand you to a human when she doesn’t know.